Grundlæggende statistik
| Institutionelle ejere | 248 total, 240 long only, 1 short only, 7 long/short - change of -6,90% MRQ |
| Gennemsnitlig porteføljeallokering | 0.3742 % - change of -16,98% MRQ |
| Institutionelle aktier (lange) | 26.337.925 (ex 13D/G) - change of 1,39MM shares 4,48% MRQ |
| Institutionel værdi (lang) | $ 2.246.058 USD ($1000) |
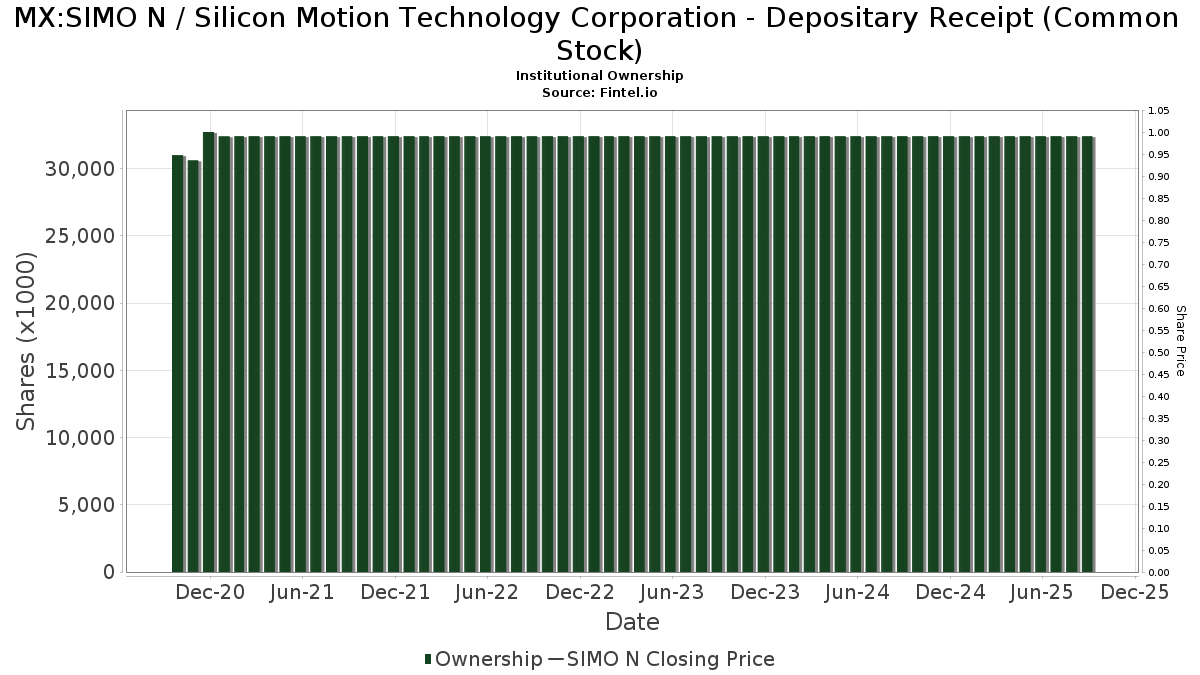
Institutionelt ejerskab og aktionærer
Silicon Motion Technology Corporation - Depositary Receipt (Common Stock) (MX:SIMO N) har 248 institutionelle ejere og aktionærer, der har indsendt 13D/G- eller 13F-formularer til Securities Exchange Commission (SEC). Disse institutioner har i alt 26,337,925 aktier. Største aktionærer omfatter Fmr Llc, Reinhart Partners, Inc., Acadian Asset Management Llc, Pertento Partners LLP, Lord, Abbett & Co. Llc, Hawk Ridge Capital Management Lp, Lazard Asset Management Llc, Wellington Management Group Llp, Invesco Ltd., and Robeco Institutional Asset Management B.V. .
Silicon Motion Technology Corporation - Depositary Receipt (Common Stock) (BMV:SIMO N) institutionel ejerskabsstruktur viser aktuelle positioner i virksomheden efter institutioner og fonde, samt seneste ændringer i positionsstørrelse. Større aktionærer kan omfatte individuelle investorer, investeringsforeninger, hedgefonde eller institutioner. Skema 13D angiver, at investoren besidder (eller besidder) mere end 5 % af virksomheden og har til hensigt (eller har til hensigt at) aktivt at forfølge en ændring i forretningsstrategi. Skema 13G indikerer en passiv investering på over 5%.
Fondens stemningsscore
Fund Sentiment Score (fka Ownership Accumulation Score) finder de aktier, der bliver mest købt af fonde. Det er resultatet af en sofistikeret, multi-faktor kvantitativ model, der identificerer virksomheder med de højeste niveauer af institutionel akkumulering. Scoringsmodellen bruger en kombination af den samlede stigning i oplyste ejere, ændringerne i porteføljeallokeringer i disse ejere og andre målinger. Tallet går fra 0 til 100, hvor højere tal indikerer et højere niveau af akkumulering for sine jævnaldrende, og 50 er gennemsnittet.
Opdateringsfrekvens: Dagligt
Se Ownership Explorer, som giver en liste over højest rangerende virksomheder.
AI+ Ask Fintel’s AI assistant about Silicon Motion Technology Corporation - Depositary Receipt (Common Stock).
Select a question to share a public post with an AI-crafted answer.
Thinking of good questions…
13F og NPORT arkivering
Detaljer om 13F-arkivering er gratis. Detaljer om NP-ansøgninger kræver et premium-medlemskab. Grønne rækker angiver nye positioner. Røde rækker angiver lukkede positioner. Klik på linket ikon for at se den fulde transaktionshistorik.
Opgrader
for at låse premium-data op og eksportere til Excel ![]() .
.
| Fil dato | Kilde | Investor | Type | Gennemsnitlig pris (Øst) |
Aktier | Δ Aktier (%) |
Rapporteret Værdi ($1000) |
Δ Værdi (%) |
Port Alloc (%) |
|
|---|---|---|---|---|---|---|---|---|---|---|
| 2026-02-10 | 13F | Easterly Investment Partners Llc | 123.807 | -0,18 | 11.477 | -2,40 | ||||
| 2026-02-17 | 13F | Jones Financial Companies Lllp | 57 | -24,00 | 5 | -16,67 | ||||
| 2026-04-24 | 13F | Bayban | 0 | -100,00 | 0 | |||||
| 2026-02-13 | 13F | University Of Texas/texas Am Investment Managment Co | 15.256 | 1.414 | ||||||
| 2026-03-03 | 13F/A | Caitong International Asset Management Co., Ltd | 23 | -85,35 | 2 | -85,71 | ||||
| 2026-02-09 | 13F | Huntington National Bank | 81 | 9,46 | 8 | 0,00 | ||||
| 2025-11-14 | 13F | State Of Wisconsin Investment Board | 0 | -100,00 | 0 | |||||
| 2026-02-06 | 13F | Hardy Reed LLC | 4.844 | -2,26 | 449 | -4,26 | ||||
| 2026-02-17 | 13F | Adage Capital Partners Gp, L.l.c. | 371.662 | -16,70 | 34.453 | -18,55 | ||||
| 2026-02-09 | 13F | Harbour Investments, Inc. | 0 | -100,00 | 0 | |||||
| 2026-01-30 | 13F | Us Bancorp \de\ | 16.945 | 35,21 | 1.571 | 32,15 | ||||
| 2026-02-17 | 13F | Aspen Grove Capital, LLC | 2.507 | -29,10 | 232 | -30,75 | ||||
| 2026-02-06 | 13F | Abn Amro Investment Solutions | 106.851 | 159,47 | 9.905 | 153,71 | ||||
| 2026-02-17 | 13F | Jump Financial, LLC | 22.000 | 113,59 | 2.039 | 108,91 | ||||
| 2026-02-11 | 13F | Erste Asset Management GmbH | 4.000 | 371 | ||||||
| 2026-01-29 | 13F | Camelot Portfolios, LLC | 2.389 | -14,74 | 221 | -16,60 | ||||
| 2026-01-30 | 13F | Caldwell Securities, Inc | 32 | 0,00 | 3 | -33,33 | ||||
| 2026-01-29 | 13F | IMC-Chicago, LLC | Call | 18.800 | -38,36 | 1.743 | -39,74 | |||
| 2026-01-26 | 13F | Private Trust Co Na | 54 | 0,00 | 5 | 0,00 | ||||
| 2026-02-13 | 13F | National Bank Of Canada /fi/ | 375 | 0,00 | 35 | -2,86 | ||||
| 2026-02-17 | 13F | Alliancebernstein L.p. | 6.236 | 578 | ||||||
| 2026-02-13 | 13F | MAI Capital Management | 15 | 0,00 | 1 | 0,00 | ||||
| 2026-02-13 | 13F | Walleye Trading LLC | 0 | -100,00 | 0 | -100,00 | ||||
| 2026-02-13 | 13F | Marshall Wace, Llp | 132.651 | 12.297 | ||||||
| 2026-02-17 | 13F | Think Investments LP | 289.300 | 0,00 | 26.818 | -2,22 | ||||
| 2026-02-05 | 13F | Bessemer Group Inc | 16 | -33,33 | 0 | |||||
| 2026-02-05 | 13F | Gamco Investors, Inc. Et Al | 18.560 | -17,84 | 1.721 | -19,66 | ||||
| 2025-11-14 | 13F | Skopos Labs, Inc. | 0 | -100,00 | 0 | |||||
| 2026-04-17 | 13F | Bell Investment Advisors, Inc | 93 | 9,41 | 10 | 42,86 | ||||
| 2026-02-17 | 13F | Polar Asset Management Partners Inc. | 0 | -100,00 | 0 | -100,00 | ||||
| 2026-02-17 | 13F | Kite Lake Capital Management (uk) Llp | 456.271 | 25,02 | 42.296 | 22,24 | ||||
| 2026-02-17 | 13F | Advisor Group Holdings, Inc. | 7.094 | -74,51 | 658 | -70,54 | ||||
| 2026-01-30 | 13F | NJ State Employees Deferred Compensation Plan | 0 | -100,00 | 0 | |||||
| 2025-11-14 | 13F | Wolverine Trading, Llc | Put | 0 | -100,00 | 0 | -100,00 | |||
| 2026-02-17 | 13F | potrero capital research llc | 0 | -100,00 | 0 | |||||
| 2026-02-17 | 13F | Melqart Asset Management (uk) Ltd | 98.417 | -7,30 | 9.123 | -9,37 | ||||
| 2026-02-13 | 13F | State Street Corp | 91.040 | 13,48 | 8.439 | 10,95 | ||||
| 2026-02-17 | 13F | Man Group plc | 381.048 | 820,74 | 35.323 | 800,41 | ||||
| 2026-02-17 | 13F | Royal Bank Of Canada | 46.927 | -12,55 | 4.349 | -14,52 | ||||
| 2026-02-17 | 13F | Creative Planning | 4.811 | -0,93 | 446 | -3,26 | ||||
| 2026-02-13 | 13F | Pinnacle Wealth Planning Services, Inc. | 303 | 28 | ||||||
| 2026-02-17 | 13F | Summit Partners Public Asset Management, Llc | Call | 0 | -100,00 | 0 | ||||
| 2026-02-17 | 13F | Summit Partners Public Asset Management, Llc | Put | 0 | -100,00 | 0 | ||||
| 2026-02-17 | 13F | Oberweis Asset Management Inc/ | 236.300 | 2,47 | 21.905 | 0,19 | ||||
| 2026-02-17 | 13F | Sora Investors Llc | 128.221 | 79,24 | 11.886 | 75,26 | ||||
| 2026-02-17 | 13F | Northern Trust Corp | 125.464 | -8,38 | 11.631 | -10,41 | ||||
| 2026-02-13 | 13F | Toroso Investments, LLC | 28.118 | 32,32 | 2.607 | 29,39 | ||||
| 2026-04-21 | 13F | Robeco Institutional Asset Management B.V. | 631.581 | 1,22 | 70.920 | 22,61 | ||||
| 2026-02-06 | 13F | Global Retirement Partners, LLC | 1.131 | 88,81 | 105 | 85,71 | ||||
| 2026-02-12 | 13F | M&G Plc | 202.799 | 12,02 | 18.860 | 9,66 | ||||
| 2026-02-12 | 13F | New York State Common Retirement Fund | 36.015 | 0,00 | 3.339 | -2,23 | ||||
| 2026-02-13 | 13F | Citigroup Inc | 3.698 | 8,67 | 343 | 6,21 | ||||
| 2026-02-18 | 13F | GWM Advisors LLC | 0 | -100,00 | 0 | |||||
| 2026-02-17 | 13F | Susquehanna Portfolio Strategies, LLC | 77.322 | 0,00 | 7.168 | -2,22 | ||||
| 2026-04-23 | 13F | CBOE Vest Financial, LLC | 2.263 | -13,13 | 254 | 5,39 | ||||
| 2026-02-17 | 13F | Clearline Capital LP | 132.911 | -21,67 | 12.321 | -23,42 | ||||
| 2026-01-26 | 13F | Cwm, Llc | 2 | 0,00 | 0 | |||||
| 2025-11-07 | 13F | Credit Industriel Et Commercial | 0 | -100,00 | 0 | |||||
| 2026-02-17 | 13F | Jain Global LLC | 61.789 | 137,59 | 5.728 | 132,33 | ||||
| 2026-01-30 | 13F | BancorpSouth Bank | 15.969 | 3,23 | 1.480 | 0,95 | ||||
| 2026-02-06 | 13F | Covestor Ltd | 4.351 | 5,76 | 0 | |||||
| 2026-02-11 | 13F | Simplex Trading, Llc | Put | 0 | -100,00 | 0 | -100,00 | |||
| 2026-02-11 | 13F | Simplex Trading, Llc | Call | 0 | -100,00 | 0 | -100,00 | |||
| 2025-11-14 | 13F | Trexquant Investment LP | 0 | -100,00 | 0 | |||||
| 2026-02-12 | 13F | Campbell & CO Investment Adviser LLC | 7.406 | 687 | ||||||
| 2026-02-11 | 13F | Parallel Advisors, LLC | 715 | 6,88 | 66 | 4,76 | ||||
| 2026-04-21 | 13F | Financial Consulate, Inc | 107 | 0,00 | 12 | 33,33 | ||||
| 2026-03-11 | 13F | Leonteq Securities AG | 0 | -100,00 | 0 | |||||
| 2026-02-12 | 13F | Principal Securities, Inc. | 0 | -100,00 | 0 | |||||
| 2026-02-17 | 13F | Prelude Capital Management, Llc | 6.901 | -54,48 | 640 | -55,53 | ||||
| 2025-11-14 | 13F | Black Maple Capital Management LP | Put | 0 | -100,00 | 0 | ||||
| 2026-02-17 | 13F | Bank Of America Corp /de/ | 183.417 | 1,34 | 17.003 | -0,91 | ||||
| 2026-02-19 | 13F | Invesco Ltd. | 632.105 | -30,22 | 58.596 | -31,78 | ||||
| 2026-02-13 | 13F | Walleye Trading LLC | Put | 1.600 | -97,55 | 148 | -97,61 | |||
| 2026-02-13 | 13F | Walleye Trading LLC | Call | 2.900 | -85,78 | 269 | -86,14 | |||
| 2026-01-27 | 13F | Proffitt & Goodson Inc | 69 | 0,00 | 6 | 0,00 | ||||
| 2026-02-12 | 13F | Federation des caisses Desjardins du Quebec | 25 | 0,00 | 2 | 0,00 | ||||
| 2026-02-13 | 13F | Squarepoint Ops LLC | 15.430 | 1.430 | ||||||
| 2026-02-10 | 13F | Goldman Sachs Group Inc | 37.966 | -6,03 | 3.519 | -8,12 | ||||
| 2026-02-04 | 13F | West Tower Group, LLC | 12.300 | 0,00 | 1.140 | -2,23 | ||||
| 2026-03-26 | 13F/A | Peak6 Llc | Put | 0 | -100,00 | 0 | -100,00 | |||
| 2026-02-12 | 13F | BlackRock, Inc. | 70.190 | -11,02 | 6.507 | -13,00 | ||||
| 2026-02-09 | 13F | Royce & Associates Lp | 92.540 | 41,28 | 8.578 | 38,13 | ||||
| 2025-11-13 | 13F | Total Investment Management Inc | 0 | -100,00 | 0 | |||||
| 2026-02-18 | 13F | Vident Advisory, LLC | 26.452 | -5,97 | 2.452 | -8,03 | ||||
| 2026-02-13 | 13F | Rhumbline Advisers | 3.997 | 26,49 | 371 | 23,75 | ||||
| 2026-02-09 | 13F | Systematic Financial Management Lp | 582.826 | -0,93 | 54.028 | -3,14 | ||||
| 2026-02-17 | 13F | Ardsley Advisory Partners Lp | 0 | -100,00 | 0 | |||||
| 2026-02-11 | 13F | Heartland Advisors Inc | 272.398 | -23,43 | 25.251 | -25,14 | ||||
| 2026-02-11 | 13F | Group One Trading, L.p. | Put | 15.300 | -32,00 | 1.418 | -33,52 | |||
| 2026-02-17 | 13F | Wiley Bros.-aintree Capital, Llc | 13.620 | 0,15 | 1.263 | -2,09 | ||||
| 2026-01-20 | 13F | Stratos Wealth Partners, LTD. | 2.290 | 1,42 | 212 | -0,93 | ||||
| 2026-02-17 | 13F | Osterweis Capital Management Inc | 5.222 | 45,14 | ||||||
| 2026-02-11 | 13F | Group One Trading, L.p. | Call | 31.400 | -73,70 | 2.911 | -74,29 | |||
| 2026-02-05 | 13F | Atria Investments Llc | 3.642 | -3,14 | 338 | -5,34 | ||||
| 2026-02-10 | 13F | Clear Harbor Asset Management, LLC | 0 | -100,00 | 0 | |||||
| 2026-02-13 | 13F | Arrowstreet Capital, Limited Partnership | 200.476 | 132,27 | 18.584 | 127,10 | ||||
| 2026-02-13 | 13F | Van Eck Associates Corp | 31.180 | -2,52 | 3 | -33,33 | ||||
| 2026-04-08 | 13F | Canandaigua National Corp | 1.815 | 204 | ||||||
| 2026-04-23 | 13F | Oppenheimer Asset Management Inc. | 12.940 | 10,37 | 1.453 | 33,79 | ||||
| 2026-02-10 | 13F | Bnp Paribas Arbitrage, Sa | 5.351 | 92,69 | 496 | 88,59 | ||||
| 2026-02-12 | 13F | Brinker Capital Investments, LLC | 13.625 | -17,76 | 1.263 | -19,55 | ||||
| 2025-11-14 | 13F | Point72 Hong Kong Ltd | 0 | -100,00 | 0 | |||||
| 2025-11-14 | 13F | Ubs Asset Management Americas Inc | 0 | -100,00 | 0 | |||||
| 2025-11-13 | 13F | Renaissance Technologies Llc | 0 | -100,00 | 0 | -100,00 | ||||
| 2026-02-17 | 13F | Pertento Partners LLP | 1.151.411 | -10,77 | 106.736 | -12,76 | ||||
| 2026-04-10 | 13F | Henry James International Management Inc. | 3.615 | 406 | ||||||
| 2026-02-13 | 13F | Lord, Abbett & Co. Llc | 994.977 | -12,31 | 92 | -14,02 | ||||
| 2026-02-10 | 13F | Quantbot Technologies LP | 1 | 0 | ||||||
| 2026-02-17 | 13F | Apis Capital Advisors, LLC | 214.080 | -25,15 | 19.845 | -26,81 | ||||
| 2026-02-09 | 13F | Legal & General Group Plc | 7.470 | -10,42 | 692 | -12,41 | ||||
| 2026-02-13 | 13F | Herald Investment Management Ltd | 384.906 | 0,00 | 35.642 | -2,07 | ||||
| 2025-11-12 | 13F | Cambridge Investment Research Advisors, Inc. | 0 | -100,00 | 0 | |||||
| 2026-02-13 | 13F | Heights Point Management, LP | 34.770 | 3.223 | ||||||
| 2025-11-14 | 13F | Knightsbridge Asset Management, Llc | 101.105 | -1,85 | 9.585 | 24,05 | ||||
| 2026-02-13 | 13F/A | Alberta Investment Management Corp | 0 | -100,00 | 0 | |||||
| 2026-02-17 | 13F | Concentric Capital Strategies, LP | 69.044 | -30,18 | 6.400 | -31,74 | ||||
| 2026-02-06 | 13F | Gsa Capital Partners Llp | 9.991 | 119,05 | 1 | |||||
| 2026-02-05 | 13F | Td Private Client Wealth Llc | 814 | -3,33 | 75 | -5,06 | ||||
| 2026-02-10 | 13F/A | Northwestern Mutual Wealth Management Co | 284 | 3,65 | 26 | 4,00 | ||||
| 2026-02-13 | 13F | First Trust Advisors Lp | 41.719 | -5,10 | 3.867 | -7,20 | ||||
| 2025-11-14 | 13F | LMR Partners LLP | 0 | -100,00 | 0 | -100,00 | ||||
| 2026-02-13 | 13F | Walleye Capital LLC | Call | 1.000 | 93 | |||||
| 2026-02-13 | 13F | Walleye Capital LLC | Put | 1.600 | 148 | |||||
| 2025-10-27 | 13F | First Horizon Corp | 0 | -100,00 | 0 | |||||
| 2026-02-13 | 13F | Solstein Capital, LLC | 300 | 0,00 | 28 | -3,57 | ||||
| 2026-02-13 | 13F | Walleye Capital LLC | 70.743 | 6.558 | ||||||
| 2026-02-13 | 13F | Headlands Technologies LLC | 4.294 | 398 | ||||||
| 2026-04-22 | 13F | MeadowBrook Investment Advisors LLC | 785 | 1,95 | 88 | 23,94 | ||||
| 2026-02-17 | 13F | Citadel Advisors Llc | Put | 27.700 | 50,54 | 2.568 | 47,19 | |||
| 2026-02-17 | 13F | XTX Topco Ltd | 31.855 | 2.953 | ||||||
| 2025-11-14 | 13F | Manatuck Hill Partners, LLC | 0 | -100,00 | 0 | |||||
| 2026-02-17 | 13F | D. E. Shaw & Co., Inc. | 102.038 | 29,87 | 9.459 | 26,97 | ||||
| 2026-04-08 | 13F | Legacy Wealth Asset Management, LLC | 2.338 | 263 | ||||||
| 2026-02-17 | 13F | Citadel Advisors Llc | Call | 32.700 | -13,03 | 3.031 | -14,96 | |||
| 2025-12-09 | 13F/A | Tudor Investment Corp Et Al | Put | 0 | -100,00 | 0 | -100,00 | |||
| 2026-02-17 | 13F | Citadel Advisors Llc | 133.056 | 82,89 | 12.334 | 78,83 | ||||
| 2026-04-15 | 13F | FNY Investment Advisers, LLC | 750 | -25,00 | 0 | |||||
| 2026-01-15 | 13F | Nisa Investment Advisors, Llc | 45 | 4 | ||||||
| 2026-02-04 | 13F | Schwartz Investment Counsel Inc | 220.000 | 0,00 | 20.394 | -2,22 | ||||
| 2026-01-20 | 13F | Harbor Capital Advisors, Inc. | 68.556 | 1,92 | 6 | 0,00 | ||||
| 2026-02-17 | 13F | Wellington Management Group Llp | 696.999 | 0,15 | 64.612 | -2,08 | ||||
| 2026-04-22 | 13F | Skylands Capital, LLC | 49.169 | -7,61 | 5.521 | 11,92 | ||||
| 2026-02-06 | 13F | Vestmark Advisory Solutions, Inc. | 13.472 | 1.249 | ||||||
| 2026-01-28 | 13F | Oversea-Chinese Banking CORP Ltd | 75.707 | 7.014 | ||||||
| 2026-02-11 | 13F | Ramirez Asset Management, Inc. | 31.604 | 2.930 | ||||||
| 2026-02-17 | 13F | Harvest Management Llc | 5.000 | 0,00 | 464 | -2,32 | ||||
| 2026-02-10 | 13F | Nomura Asset Management Co Ltd | 0 | 0 | ||||||
| 2026-02-13 | 13F | Mml Investors Services, Llc | 3.887 | 5,42 | 360 | 3,15 | ||||
| 2026-02-13 | 13F | Cramer Rosenthal Mcglynn Llc | 143.604 | 13.312 | ||||||
| 2026-02-10 | 13F | Natixis Advisors, L.p. | 0 | -100,00 | 0 | |||||
| 2026-02-13 | 13F | Sei Investments Co | 95.396 | 55,83 | 8.843 | 52,36 | ||||
| 2026-04-24 | 13F | Deltec Asset Management Llc | 0 | -100,00 | 0 | |||||
| 2026-02-03 | 13F | F/M Investments LLC | 49.010 | -2,59 | 4.543 | -4,76 | ||||
| 2026-04-24 | 13F | UMA Financial Services, Inc. | 16 | -40,74 | 2 | -50,00 | ||||
| 2026-02-17 | 13F | Cetera Investment Advisers | 2.411 | -2,39 | 223 | -4,70 | ||||
| 2026-02-13 | 13F | Boston Partners | 383.801 | -28,85 | 35.590 | -30,41 | ||||
| 2026-02-17 | 13F | Balyasny Asset Management Llc | 142.561 | 11,98 | 13.215 | 9,50 | ||||
| 2026-04-22 | 13F | Patriot Financial Group Insurance Agency, LLC | 6.560 | 119,84 | 737 | 166,67 | ||||
| 2026-02-17 | 13F | Grantham, Mayo, Van Otterloo & Co. LLC | 16.100 | 0,00 | 1.492 | -2,23 | ||||
| 2025-11-14 | 13F | Point72 Asia (Singapore) Pte. Ltd. | 21.188 | 2.009 | ||||||
| 2026-02-17 | 13F | Qube Research & Technologies Ltd | 95.389 | 8.843 | ||||||
| 2026-02-14 | 13F | Rockefeller Capital Management L.P. | 6.068 | 25,37 | 563 | 22,71 | ||||
| 2026-02-11 | 13F | Jpmorgan Chase & Co | 17.494 | 102,62 | 1.622 | 98,17 | ||||
| 2026-02-10 | 13F | State of Wyoming | 5.045 | 63,59 | 468 | 59,93 | ||||
| 2026-02-13 | 13F | SRS Capital Advisors, Inc. | 446 | 220,86 | 41 | 215,38 | ||||
| 2026-04-07 | 13F | Farther Finance Advisors, LLC | 743 | -68,69 | 87 | -60,73 | ||||
| 2026-02-17 | 13F | SummitTX Capital, L.P. | 64.069 | -34,67 | 5.939 | -36,12 | ||||
| 2026-02-06 | 13F | Kilter Group LLC | 0 | -100,00 | 0 | |||||
| 2026-02-03 | 13F | Ballentine Partners, LLC | 4.006 | 2,82 | 371 | 0,54 | ||||
| 2026-04-16 | 13F | Diversified Trust Co | 8.628 | 0,00 | 969 | 21,15 | ||||
| 2026-02-13 | 13F | Pinpoint Asset Management (Singapore) Pte. Ltd. | 0 | -100,00 | 0 | |||||
| 2026-04-20 | 13F | Brian Low Financial Group, Llc | 10.495 | 11,61 | 1.178 | 35,25 | ||||
| 2026-02-13 | 13F | Macquarie Group Ltd | 0 | -100,00 | 0 | |||||
| 2026-04-20 | 13F | Naples Global Advisors, Llc | 17.199 | -1,41 | 1.931 | 19,42 | ||||
| 2026-04-22 | 13F | Janney Montgomery Scott LLC | 72.965 | -17,81 | 8 | 0,00 | ||||
| 2026-01-27 | 13F | Cannon Global Investment Management, LLC | 0 | -100,00 | 0 | |||||
| 2026-02-06 | 13F | Pnc Financial Services Group, Inc. | 5.298 | 0,00 | 491 | -2,19 | ||||
| 2026-02-17 | 13F | Numerai GP LLC | 2.309 | 214 | ||||||
| 2025-11-14 | 13F | Peak6 Llc | Call | 0 | -100,00 | 0 | -100,00 | |||
| 2026-02-13 | 13F | Wolf Hill Capital Management, LP | 581.370 | 53.893 | ||||||
| 2026-02-17 | 13F | Tower Research Capital LLC (TRC) | 248 | 23 | ||||||
| 2025-11-12 | 13F | NewSquare Capital LLC | 0 | -100,00 | 0 | -100,00 | ||||
| 2026-02-13 | 13F | Schroder Investment Management Group | 37.720 | 541,82 | 3.412 | 519,24 | ||||
| 2026-01-29 | 13F | Sanctuary Advisors, LLC | 4.331 | 4,01 | 401 | 1,78 | ||||
| 2026-02-17 | 13F | Lombard Odier Asset Management (USA) Corp | 7.757 | -44,45 | 719 | -45,69 | ||||
| 2026-04-17 | 13F | HHM Wealth Advisors, LLC | 550 | -14,06 | 62 | 3,39 | ||||
| 2026-02-13 | 13F | JustInvest LLC | 8.523 | -3,19 | 790 | -5,28 | ||||
| 2026-04-21 | 13F | Alpine Associates Management Inc. | 116.878 | 46,14 | 13.124 | 77,04 | ||||
| 2026-02-09 | 13F | Employees Retirement System of Texas | 13.285 | 0,00 | 1 | 0,00 | ||||
| 2026-02-11 | 13F | LPL Financial LLC | 11.649 | 0,03 | 1.080 | -2,26 | ||||
| 2026-02-13 | 13F | Entropy Technologies, LP | 6.600 | 612 | ||||||
| 2026-02-17 | 13F | Guggenheim Capital Llc | 11.703 | 1.085 | ||||||
| 2026-02-05 | 13F | Allworth Financial LP | 188 | 64,91 | 17 | 70,00 | ||||
| 2026-02-17 | 13F | Prospect Capital Advisors, LLC | 88.350 | 0,00 | 8.190 | -2,22 | ||||
| 2026-02-13 | 13F | Morgan Stanley | 264.858 | 48,67 | 24.553 | 45,36 | ||||
| 2026-04-22 | 13F | 1492 Capital Management LLC | 0 | -100,00 | 0 | |||||
| 2026-02-17 | 13F | Summit Partners Public Asset Management, Llc | 534.932 | -4,13 | 49.588 | -6,27 | ||||
| 2026-02-17 | 13F | Delaware Management Holdings, Inc. | 109.060 | 10.110 | ||||||
| 2026-02-17 | 13F | Engineers Gate Manager LP | 8.494 | 787 | ||||||
| 2026-04-09 | 13F | Diversified Management Inc | 1.818 | 204 | ||||||
| 2025-11-14 | 13F | Marex Group plc | 0 | -100,00 | 0 | -100,00 | ||||
| 2026-02-17 | 13F | Capitolis Liquid Global Markets LLC | 83.900 | 7.778 | ||||||
| 2026-02-17 | 13F | Advisory Services Network, LLC | 0 | -100,00 | 0 | |||||
| 2026-02-17 | 13F | Frontier Capital Management Co Llc | 511.471 | -50,97 | 47.413 | -52,06 | ||||
| 2026-02-11 | 13F | Renaissance Group Llc | 11.666 | -26,60 | 1.081 | -28,22 | ||||
| 2026-01-23 | 13F | Assetmark, Inc | 2.751 | 12,06 | 255 | 9,91 | ||||
| 2026-04-20 | 13F | Ronald Blue Trust, Inc. | 1.041 | -44,95 | 117 | -33,71 | ||||
| 2026-02-12 | 13F | Oak Associates Ltd /oh/ | 32.294 | -1,79 | 2.994 | 99.666,67 | ||||
| 2026-02-12 | 13F | Advisors Asset Management, Inc. | 3.785 | 342,69 | 351 | 332,10 | ||||
| 2025-11-14 | 13F | Strategic Wealth Partners, Ltd. | 1.458 | 0,00 | 138 | 26,61 | ||||
| 2026-02-04 | 13F | LRI Investments, LLC | 2.374 | -5,27 | 220 | -7,17 | ||||
| 2026-04-21 | 13F | Wedbush Securities Inc | 4.815 | 2,77 | 1 | |||||
| 2026-03-09 | 13F/A | CI Private Wealth, LLC | 3.036 | -10,50 | 281 | -12,46 | ||||
| 2026-04-14 | 13F | Tradewinds Capital Management, LLC | 215 | 0,00 | 24 | 26,32 | ||||
| 2026-02-17 | 13F | Driehaus Capital Management Llc | 319.624 | -3,41 | 29.629 | -5,56 | ||||
| 2026-02-06 | 13F | GPS Wealth Strategies Group, LLC | 0 | -100,00 | 0 | |||||
| 2025-11-12 | 13F | GABELLI & Co INVESTMENT ADVISERS, INC. | 0 | -100,00 | 0 | |||||
| 2026-02-09 | 13F | Geode Capital Management, Llc | 43.901 | 5,98 | 4.070 | 3,62 | ||||
| 2026-02-02 | 13F | Truist Financial Corp | 2.377 | 11,18 | 220 | 8,91 | ||||
| 2026-01-27 | 13F | WealthCollab, LLC | 346 | 77,44 | 32 | 77,78 | ||||
| 2025-11-12 | 13F | Gabelli Funds Llc | 0 | -100,00 | 0 | |||||
| 2026-04-23 | 13F | North Star Investment Management Corp. | 5.400 | 0,00 | 606 | 21,20 | ||||
| 2026-01-29 | 13F | Quent Capital, LLC | 3.000 | 278 | ||||||
| 2026-02-12 | 13F | Highland Peak Capital, LLC | 0 | -100,00 | 0 | |||||
| 2026-04-14 | 13F | Opal Wealth Advisors, LLC | 272 | 31 | ||||||
| 2025-11-14 | 13F | Wolverine Trading, Llc | Call | 3.600 | -5,26 | 338 | 17,42 | |||
| 2026-01-21 | 13F | Westfuller Advisors, LLC | 22 | 0,00 | 2 | 0,00 | ||||
| 2026-04-13 | 13F | Reinhart Partners, Inc. | 1.314.039 | -16,48 | 147.555 | 1,17 | ||||
| 2026-02-17 | 13F | Two Sigma Investments, Lp | Put | 2.800 | 260 | |||||
| 2026-02-13 | 13F | Glen Eagle Advisors, LLC | 18 | 0,00 | 2 | 0,00 | ||||
| 2026-02-17 | 13F | Two Sigma Investments, Lp | Call | 4.700 | 436 | |||||
| 2026-02-13 | 13F | Aviso Wealth Management | 5.138 | -5,53 | 476 | -7,57 | ||||
| 2026-02-12 | 13F | Rossby Financial, LCC | 2 | 0,00 | 0 | |||||
| 2026-02-03 | 13F | SBI Securities Co., Ltd. | 72 | 94,59 | 7 | 100,00 | ||||
| 2026-02-12 | 13F | Commonwealth Equity Services, Llc | 7.798 | -1,58 | 723 | |||||
| 2026-02-17 | 13F | Lazard Asset Management Llc | 758.578 | -3,20 | 70.320 | -5,36 | ||||
| 2025-11-14 | 13F | Shay Capital LLC | 0 | -100,00 | 0 | -100,00 | ||||
| 2026-02-17 | 13F | Oddo Bhf Asset Management Sas | 192.500 | -11,49 | 17.845 | -13,47 | ||||
| 2026-04-09 | 13F | Tealwood Asset Management Inc | 17.157 | -0,84 | 2 | 0,00 | ||||
| 2026-04-22 | 13F | Advocate Investing Services LLC | 21 | 0,00 | 2 | 100,00 | ||||
| 2026-02-17 | 13F | Monolith Management Ltd | 0 | -100,00 | 0 | |||||
| 2026-02-03 | 13F | NewEdge Wealth, LLC | 2.631 | 3,58 | 244 | -2,80 | ||||
| 2026-02-13 | 13F | SG Capital Management LLC | 90.411 | 8.381 | ||||||
| 2026-02-12 | 13F | Jane Street Group, Llc | 79.390 | 7.359 | ||||||
| 2025-11-12 | 13F/A | Norges Bank | 190.000 | 336,34 | 11.541 | 227,28 | ||||
| 2026-01-12 | 13F | CVA Family Office, LLC | 1.054 | 0,00 | 98 | -2,02 | ||||
| 2026-01-23 | 13F | Westside Investment Management, Inc. | 395 | 0,00 | 37 | -2,70 | ||||
| 2026-02-12 | 13F | Jane Street Group, Llc | Put | 29.600 | -11,64 | 2.744 | -13,63 | |||
| 2026-02-06 | 13F | EverSource Wealth Advisors, LLC | 648 | 3,02 | 60 | 1,69 | ||||
| 2026-02-12 | 13F | Jane Street Group, Llc | Call | 58.100 | -55,41 | 5.386 | -56,41 | |||
| 2026-02-11 | 13F | Deutsche Bank Ag\ | 67.900 | 6.294 | ||||||
| 2026-02-13 | 13F | Kestra Advisory Services, LLC | 1.608 | 149 | ||||||
| 2026-02-13 | 13F | Transamerica Financial Advisors, Inc. | 15 | 1 | ||||||
| 2025-10-31 | 13F | Whittier Trust Co | 0 | -100,00 | 0 | |||||
| 2026-02-09 | 13F | Penn Capital Management Co Inc | 4.970 | -14,62 | 461 | -16,52 | ||||
| 2026-04-14 | 13F | Beacon Investment Advisory Services, Inc. | 300 | 34 | ||||||
| 2026-02-13 | 13F | Victory Capital Management Inc | 19.350 | 0,00 | 1.794 | -2,24 | ||||
| 2026-02-17 | 13F | Two Sigma Investments, Lp | 379.837 | 390,99 | 35.211 | 380,09 | ||||
| 2026-02-13 | 13F | Manufacturers Life Insurance Company, The | 0 | -100,00 | 0 | |||||
| 2026-02-17 | 13F | Russell Investments Group, Ltd. | 198.737 | -19,02 | 18.251 | -21,27 | ||||
| 2026-04-14 | 13F | Congress Asset Management Co /ma | 20.674 | 2.321 | ||||||
| 2026-02-12 | 13F | CIBC Private Wealth Group, LLC | 110 | 0,00 | 10 | 0,00 | ||||
| 2026-02-13 | 13F | Wells Fargo & Company/mn | 66.721 | 1,56 | 6.185 | -0,69 | ||||
| 2026-02-10 | 13F | Commonwealth Of Pennsylvania Public School Empls Retrmt Sys | 3.837 | 0,00 | 356 | -2,20 | ||||
| 2026-02-12 | 13F | Barometer Capital Management Inc. | 0 | -100,00 | 0 | |||||
| 2026-02-13 | 13F | Verition Fund Management LLC | 4.463 | 414 | ||||||
| 2026-02-04 | 13F | First Eagle Investment Management, LLC | 153.519 | 2,01 | 14.231 | -0,25 | ||||
| 2026-02-13 | 13F | Centiva Capital, LP | 2.500 | -60,79 | 232 | -61,75 | ||||
| 2026-02-17 | 13F | Ophir Asset Management Pty Ltd | 467.564 | -7,50 | 43.343 | -9,56 | ||||
| 2026-02-10 | 13F | Acadian Asset Management Llc | 1.279.087 | -1,73 | 119 | -4,07 | ||||
| 2026-01-29 | 13F | UBS Group AG | 351.541 | 38,95 | 32.588 | 35,86 | ||||
| 2026-04-15 | 13F | Merit Financial Group, LLC | 3.445 | -1,74 | 387 | 18,77 | ||||
| 2026-02-17 | 13F | CastleKnight Management LP | Call | 13.700 | 1.270 | |||||
| 2026-02-17 | 13F | CastleKnight Management LP | 82.236 | 7.623 | ||||||
| 2026-02-17 | 13F | Two Sigma Advisers, Lp | 124.681 | 437,86 | 11.558 | 426,04 | ||||
| 2026-02-13 | 13F | Fifth Lane Capital, Lp | Put | 1.000 | 93 | |||||
| 2026-02-13 | 13F | Kennedy Capital Management, Inc. | 22.373 | 1,15 | 2.074 | -1,14 | ||||
| 2026-02-13 | 13F | Barclays Plc | 419 | -75,61 | 39 | -76,54 | ||||
| 2025-11-14 | 13F | Susquehanna International Group, Llp | 0 | -100,00 | 0 | -100,00 | ||||
| 2026-02-17 | 13F | Boothbay Fund Management, Llc | 63.081 | 29,80 | 5.848 | 26,92 | ||||
| 2026-02-13 | 13F | Arkadios Wealth Advisors | 4.326 | 55,39 | 401 | 52,47 | ||||
| 2026-02-17 | 13F | Ameriprise Financial Inc | Put | 0 | -100,00 | 0 | -100,00 | |||
| 2026-02-11 | 13F | CSM Advisors, LLC | 3.984 | 87,04 | 0 | |||||
| 2026-02-17 | 13F | Point72 Asset Management, L.P. | 0 | -100,00 | 0 | |||||
| 2026-02-13 | 13F | Y-Intercept (Hong Kong) Ltd | 9.328 | 865 | ||||||
| 2026-01-22 | 13F | Massachusetts Financial Services Co /ma/ | 206.716 | -64,76 | 19.163 | -65,55 | ||||
| 2026-02-10 | 13F | Bank of New York Mellon Corp | 4.212 | -2,88 | 390 | -5,11 | ||||
| 2026-02-11 | 13F | Fox Run Management, L.l.c. | 7.047 | 653 | ||||||
| 2026-02-17 | 13F | Ameriprise Financial Inc | 36.734 | -25,40 | 3.405 | -27,06 | ||||
| 2026-02-10 | 13F | Envestnet Asset Management Inc | 88.016 | -19,95 | 8.159 | -21,73 | ||||
| 2026-02-04 | 13F | Pacer Advisors, Inc. | 0 | -100,00 | 0 | |||||
| 2026-02-11 | 13F | Neumeier Poma Investment Counsel Llc | 481.818 | 0,70 | 44.665 | -1,54 | ||||
| 2026-02-17 | 13F | Susquehanna International Group, Llp | Put | 74.300 | -40,27 | 6.888 | -41,61 | |||
| 2026-02-13 | 13F | Smartleaf Asset Management LLC | 6 | -92,00 | 1 | -100,00 | ||||
| 2026-02-13 | 13F | Colony Group, LLC | 7.181 | 0,96 | 681 | 0,89 | ||||
| 2026-02-17 | 13F | Granahan Investment Management Inc/ma | 229.129 | 10,29 | 21.240 | 7,83 | ||||
| 2026-02-17 | 13F | Raymond James Financial Inc | 38.963 | 3.612 | ||||||
| 2026-02-17 | 13F | Susquehanna International Group, Llp | Call | 102.300 | -37,81 | 9.483 | -39,20 | |||
| 2026-02-17 | 13F | Tudor Investment Corp Et Al | Call | 2.500 | 232 | |||||
| 2025-11-14 | 13F | Mount Yale Investment Advisors, LLC | 0 | -100,00 | 0 | -100,00 | ||||
| 2026-04-06 | 13F | GAMMA Investing LLC | 1.252 | 11,89 | 141 | 35,92 | ||||
| 2026-04-07 | 13F | Signaturefd, Llc | 1.554 | 2,44 | 174 | 24,29 | ||||
| 2026-04-16 | 13F | SG Americas Securities, LLC | 2.172 | -86,67 | 0 | -100,00 | ||||
| 2026-02-17 | 13F | Public Employees Retirement System Of Ohio | 41.152 | 0,00 | 3.815 | -2,23 | ||||
| 2026-03-24 | 13F/A | Barclays Plc | Call | 0 | -100,00 | 0 | -100,00 | |||
| 2026-02-17 | 13F | Fmr Llc | 3.398.367 | 0,00 | 315.029 | -2,23 | ||||
| 2026-02-17 | 13F | Millennium Management Llc | 147.030 | -31,03 | 13.630 | -32,57 | ||||
| 2026-02-06 | 13F | Handelsbanken Fonder AB | 10.000 | -3,85 | 1 | |||||
| 2026-02-12 | 13F | Brown Brothers Harriman & Co | 85 | -68,52 | 8 | -72,00 | ||||
| 2026-02-12 | 13F | Hrt Financial Lp | 0 | -100,00 | 0 | |||||
| 2026-02-17 | 13F | Cinctive Capital Management LP | 0 | -100,00 | 0 | |||||
| 2026-02-13 | 13F | Mariner, LLC | 3.131 | -0,48 | 290 | -2,68 | ||||
| 2026-02-17 | 13F | Black Maple Capital Management LP | 7.300 | 677 | ||||||
| 2026-02-17 | 13F | Voloridge Investment Management, Llc | 112.458 | 10.425 | ||||||
| 2026-02-17 | 13F | Hawk Ridge Capital Management Lp | 787.747 | 111,34 | 73.024 | 106,63 | ||||
| 2026-02-12 | 13F | Quadrant Capital Group Llc | 14.600 | -21,43 | 1.353 | -23,17 | ||||
| 2026-02-13 | 13F | Stifel Financial Corp | 9.662 | -1,33 | 896 | -3,56 | ||||
| 2026-04-13 | 13F | Mather Group, Llc. | 49 | 6 | ||||||
| 2026-02-17 | 13F | Fund 1 Investments, LLC | 0 | -100,00 | 0 | |||||
| 2025-11-12 | 13F | Simplex Trading, Llc | 0 | -100,00 | 0 | |||||
| 2026-02-13 | 13F | Diametric Capital, LP | 24.365 | 118,13 | 2.259 | 113,22 | ||||
| 2026-02-11 | 13F | Cerity Partners LLC | 21.654 | -3,00 | 2.007 | -5,15 | ||||
| 2026-02-13 | 13F | Cornerstone Financial Management LLC | 37 | 3 |